Air Quality Monitoring
by Richard · 2024 年 4 月 2 日
https://www.howmuchsnow.com/arduino/airquality/
Automatically measuring and graphing Air Quality with an inexpensive device (Sharp GP2Y1010AU0F Optical Dust Sensor)
Copyright 2012, Chris Nafis
Check out my latest results with the Grove Shinyei Model PPD42NS Dust Sensor and Dylos laser particle Sensor. They are much better sensors.
Table of Contents
Background
With allergies and asthma I’m interested in both the indoor and outdoor air quality. I heat with a Quadrafire woodstove. It is suppose to be a clean stove. I was interested in the impact on both my inside air (ie. ash/dust) and outside air (smoke). New York State monitors the air quality at several locations around the State. Certified Allergy & Asthma Consultants in Albany NY published daily pollen counts. The American Lung Association has a great article called State of the AIR that talks about Particle Pollution. I have several weatherstations collecting data ( KNYREXFO1 [barn roof], KNYCLIFT1 [garage roof] ),
There are several citizen group projects that are developing open source equipment (e.g. Air Quality Egg). There are several recent discussions about adding a Particulate sensor. The Egg Project aims to give citizens a way to participate in the conversation about air quality. It is composed of a sensing device that measures the air quality in the immediate environment and an on-line community that is sharing this information in real-time. It is a community-developed, open source project that is driven by people who care about the air they breathe.
Monitoring
The $290 Dylos Laser Particle Counter (DC1100) – with Computer Interface is a true Laser Particle Counter with two different size ranges. The small channel (0.5> Micron) should see bacteria and mold. The Large channel (2.5> micron) should see dust and pollen. The LCD display constantly shows bargraphs and values for the small and large particles. The unit saves 30 days of air quality data. I ordered the unit with the PC Interface Option and connected it to an Arduino Ethernet so I can automatically log the data to Pachube. That way air quality alerts can be triggered and sent to twitter and my cell phone.

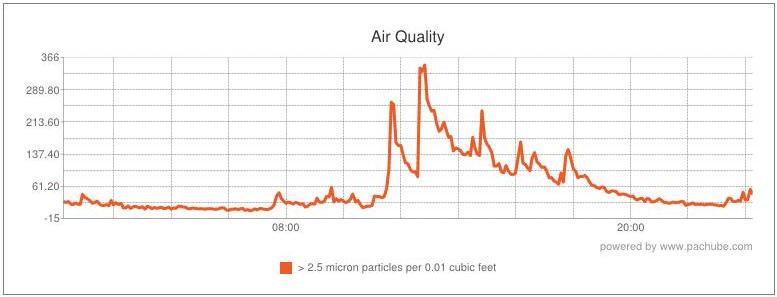
The unit is amazingly sensitive. It easily sees the dust kicked up from walking on a rug or the vapors from cooking. Looking at the graphs below you can see some interesting things. First you can see that things settle down at night when people are not walking around. You can see around noon that my daughter cooked lunch. It’s surprising how long it takes for the fine particles to settle down.

Approach
Set Up
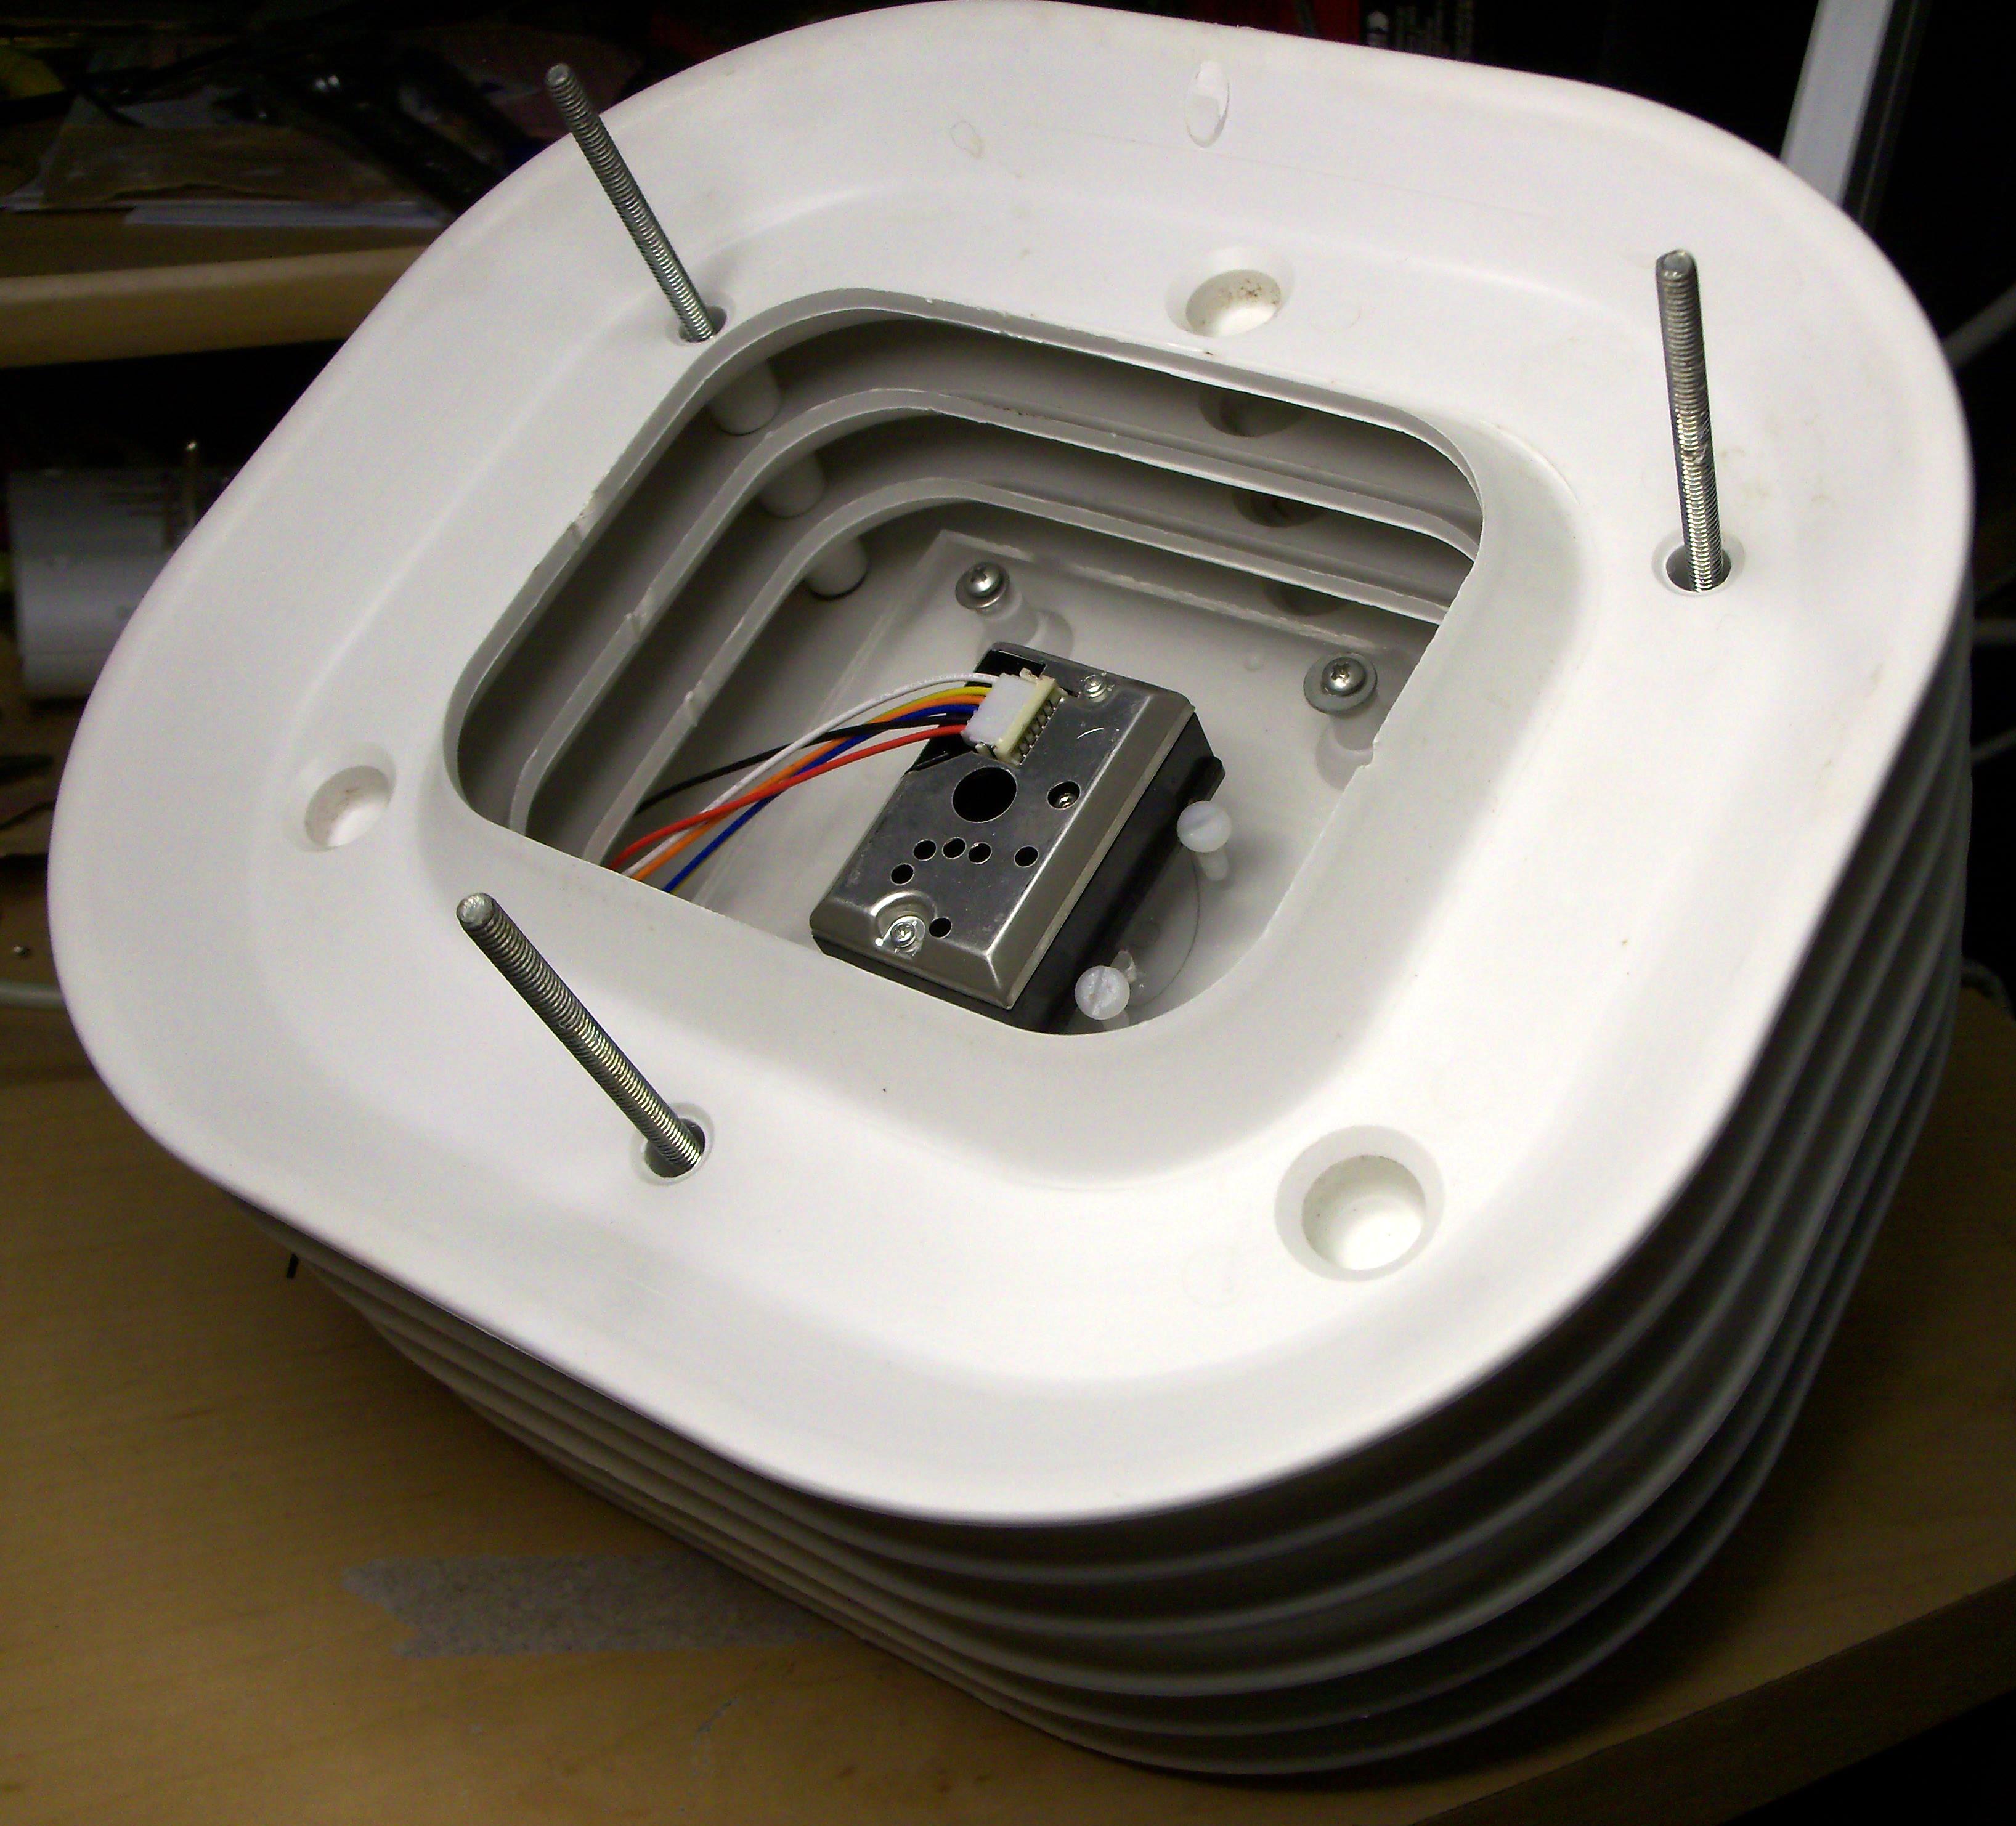
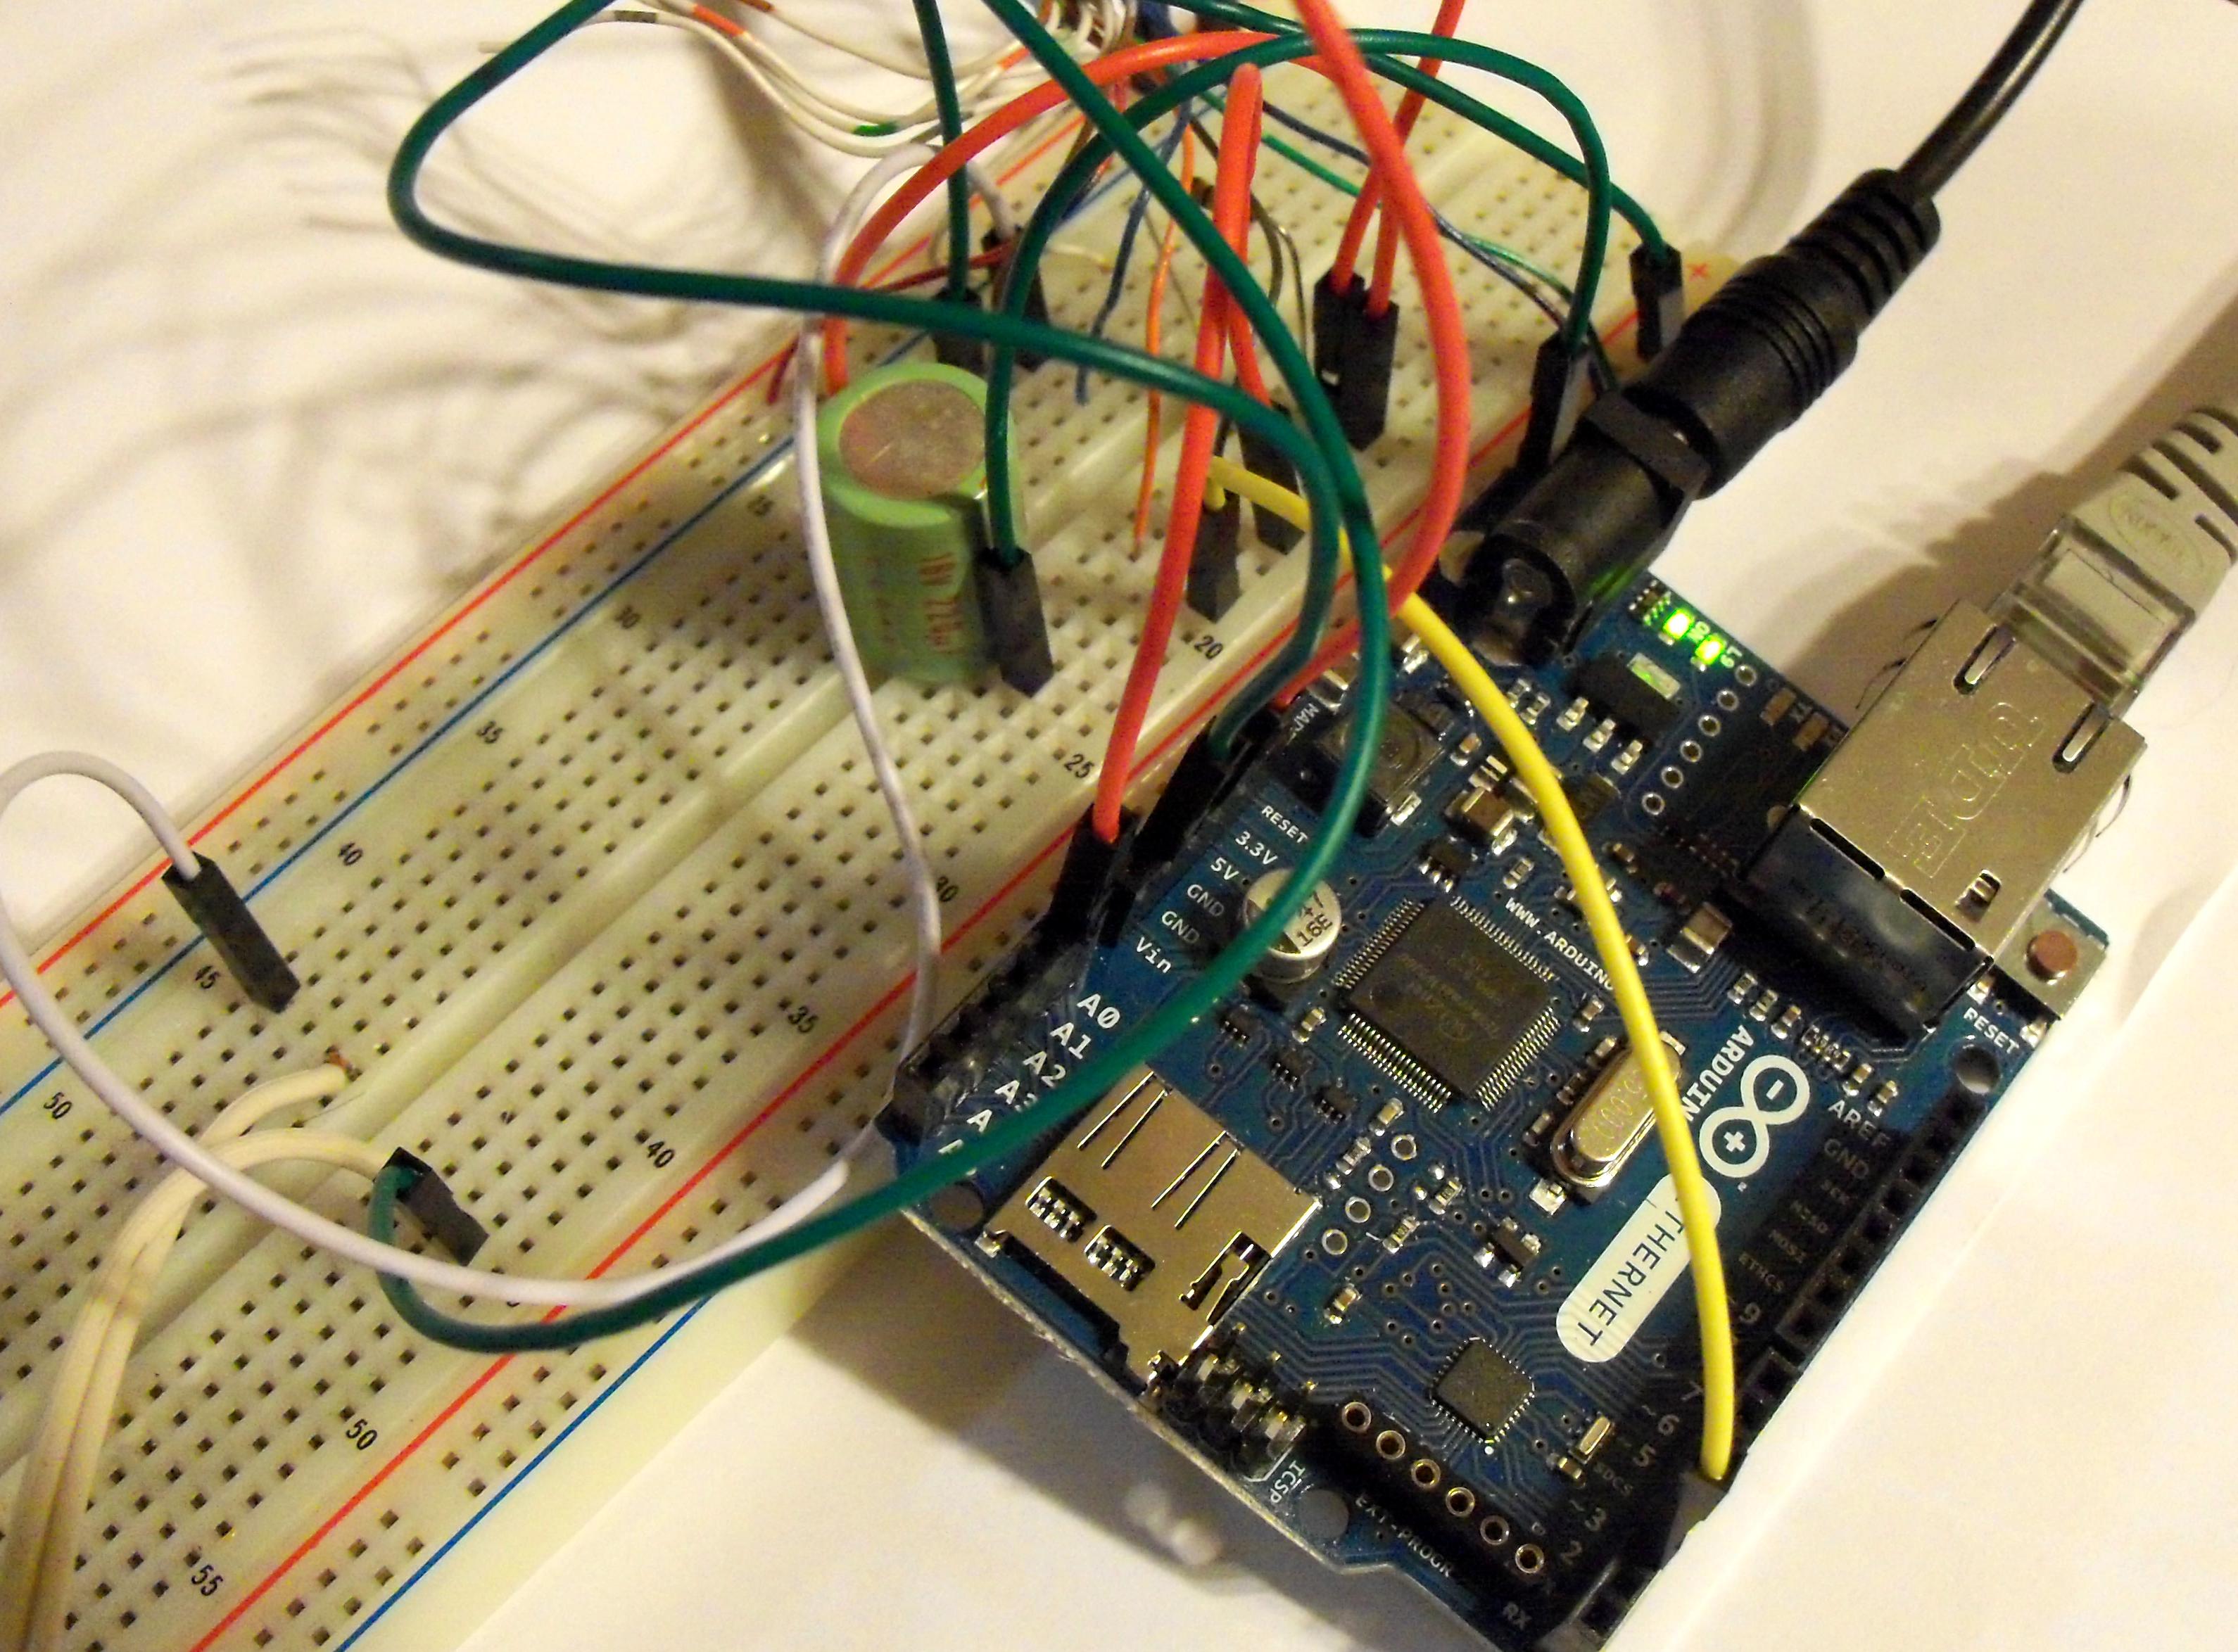
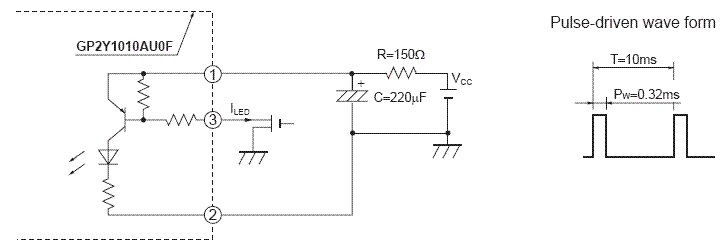
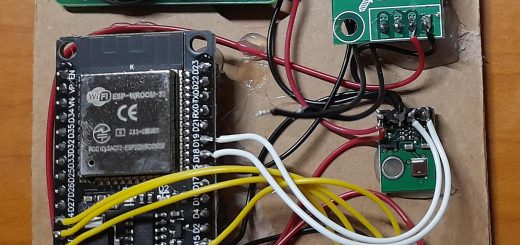
An Arduino Ethernet is connected to the Sharp sensor following the schematic in the Sharp GP2Y1010AU0F Spec sheet. The LED connected to pin 2 is turned on, after 0.28ms the analog pin A0 connected to Vo is sampled. 0.04ms later, the LED is turned off and 9.680ms is waited before the 10ms sequence is repeated (Arduino Source Code).
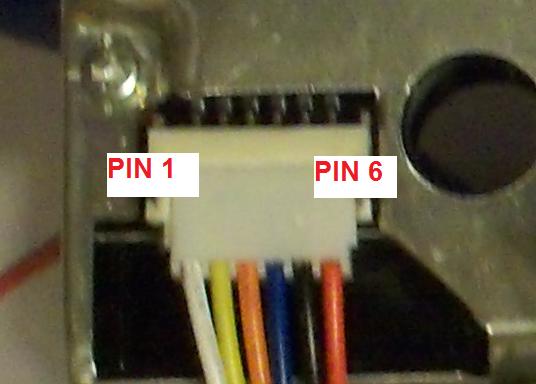
Sharp pin 1 (V-LED)   => 5V (connected to 150ohm resister)
Sharp pin 2 (LED-GND) => Arduino GND pin
Sharp pin 3 (LED)     => Arduino pin 2
Sharp pin 4 (S-GND)   => Arduino GND pin
Sharp pin 5 (Vo)      => Arduino A0 pin
Sharp pin 6 (Vcc)     => 5V
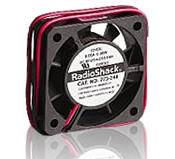
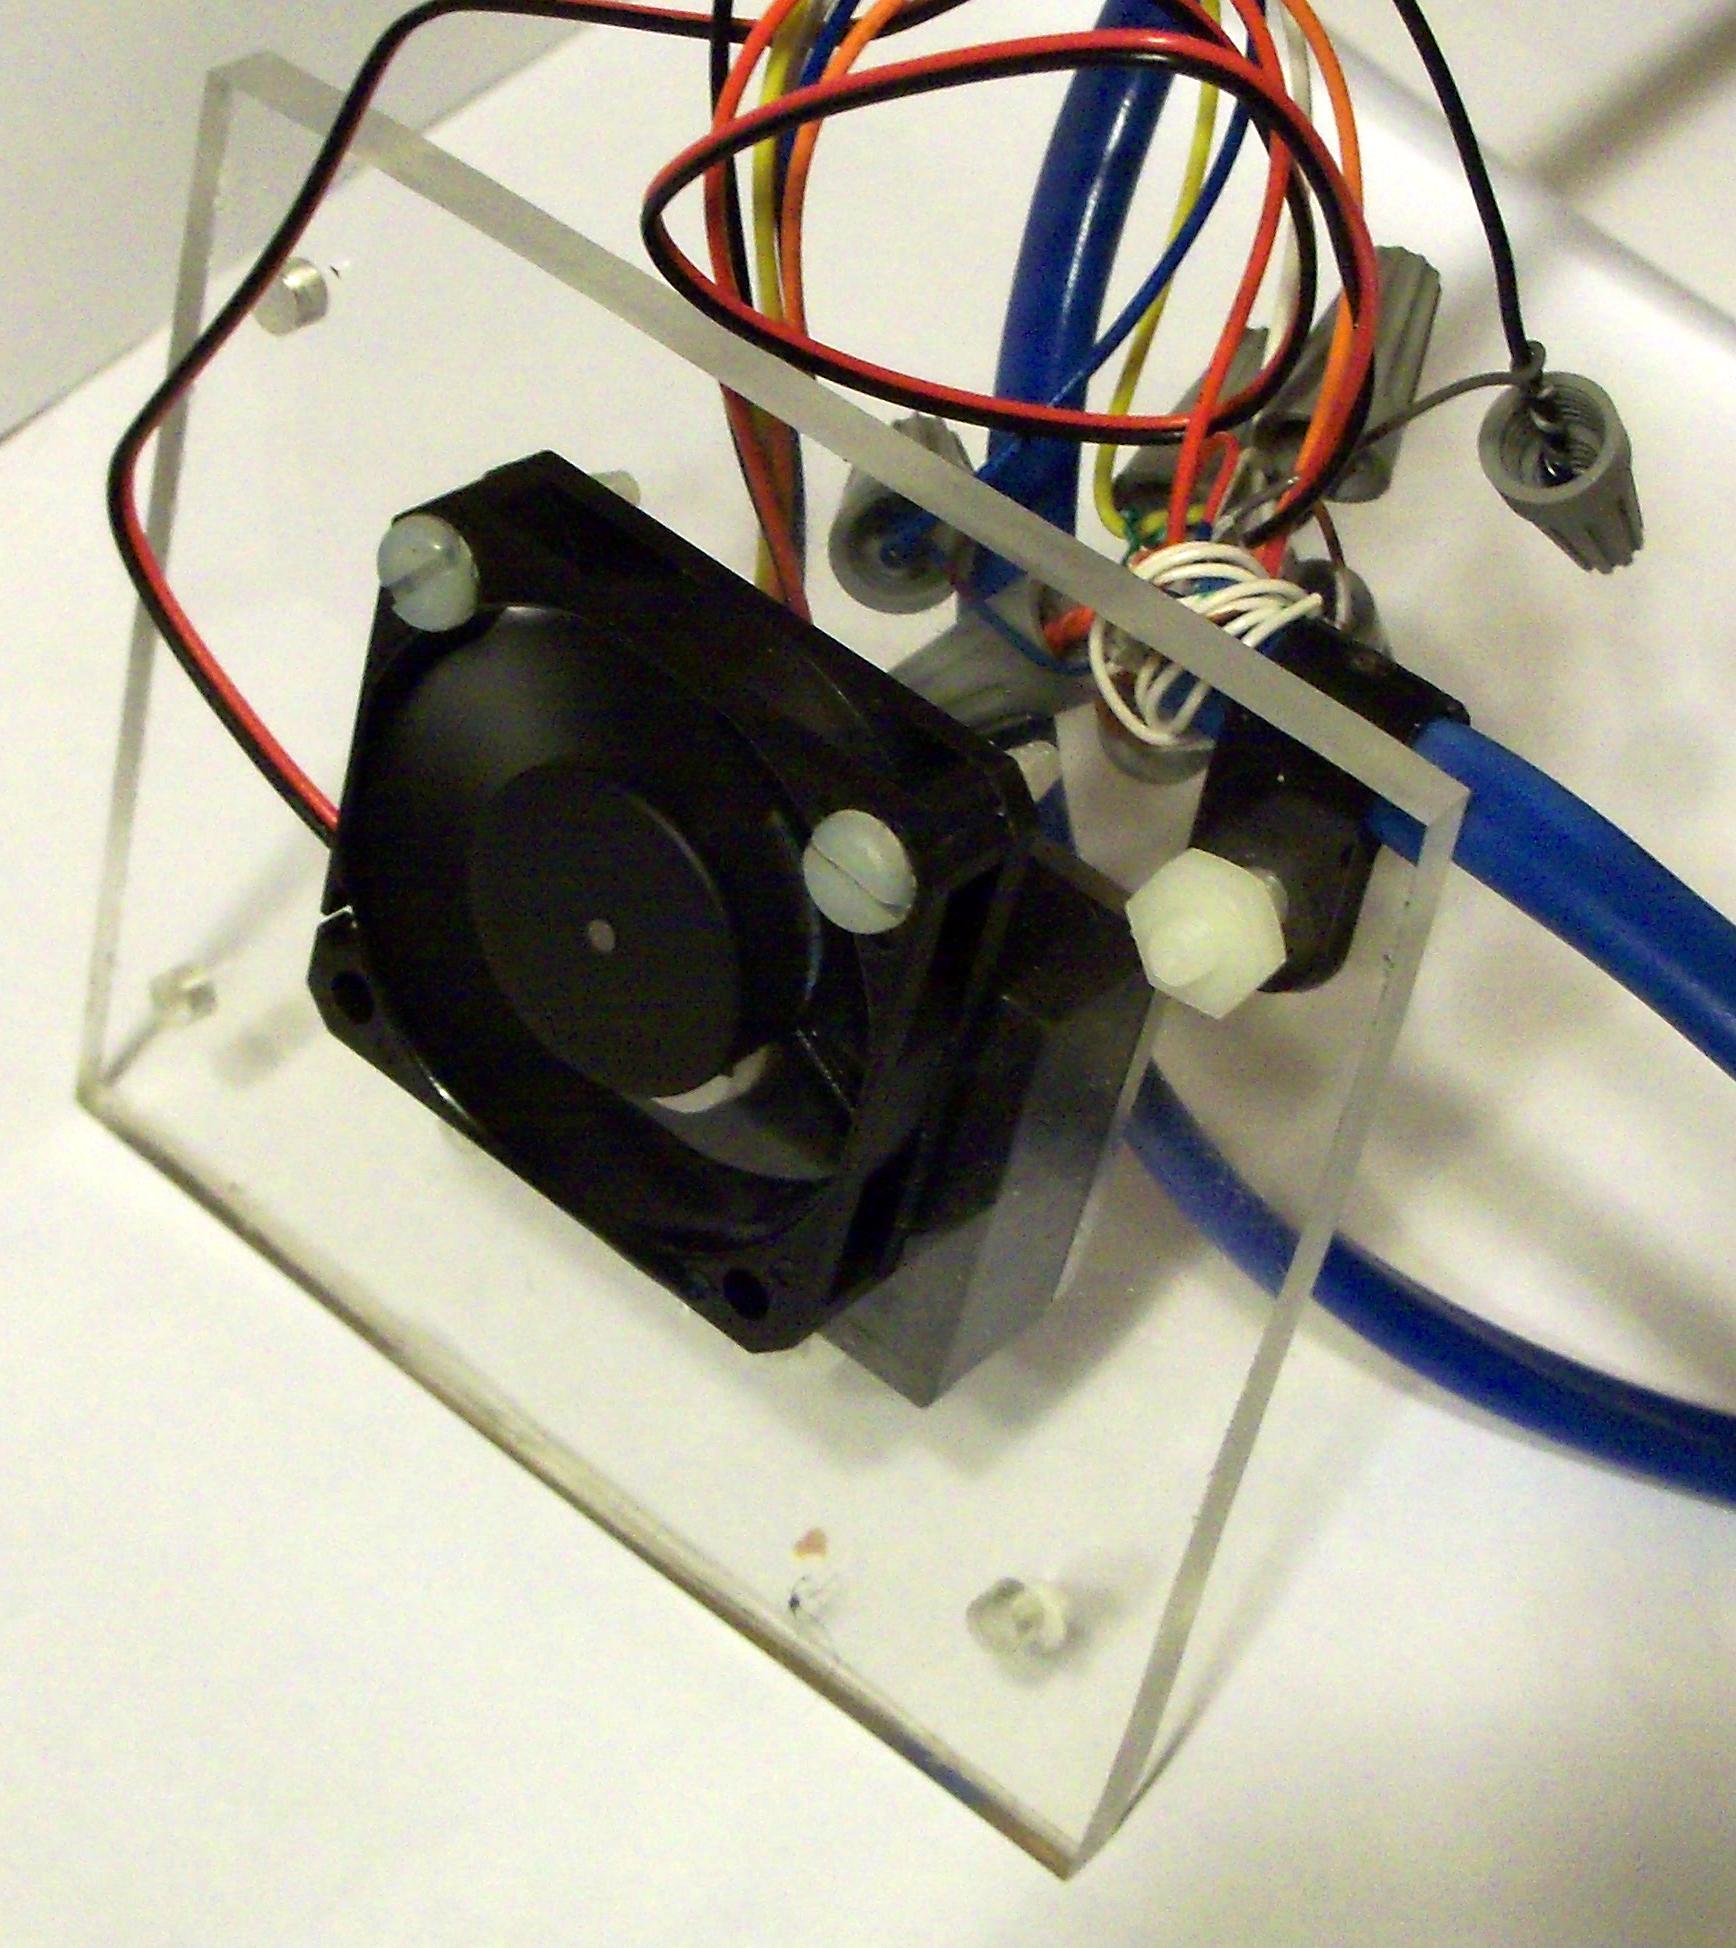
I used a small 40mm fan to help make sure air was circulated thru the Sharp sensor. This probably is not required, but since I am mounting one of the sensors outside in a radiation shield, I wanted to make sure I saw any pollen floating by.
Testing and Calibration
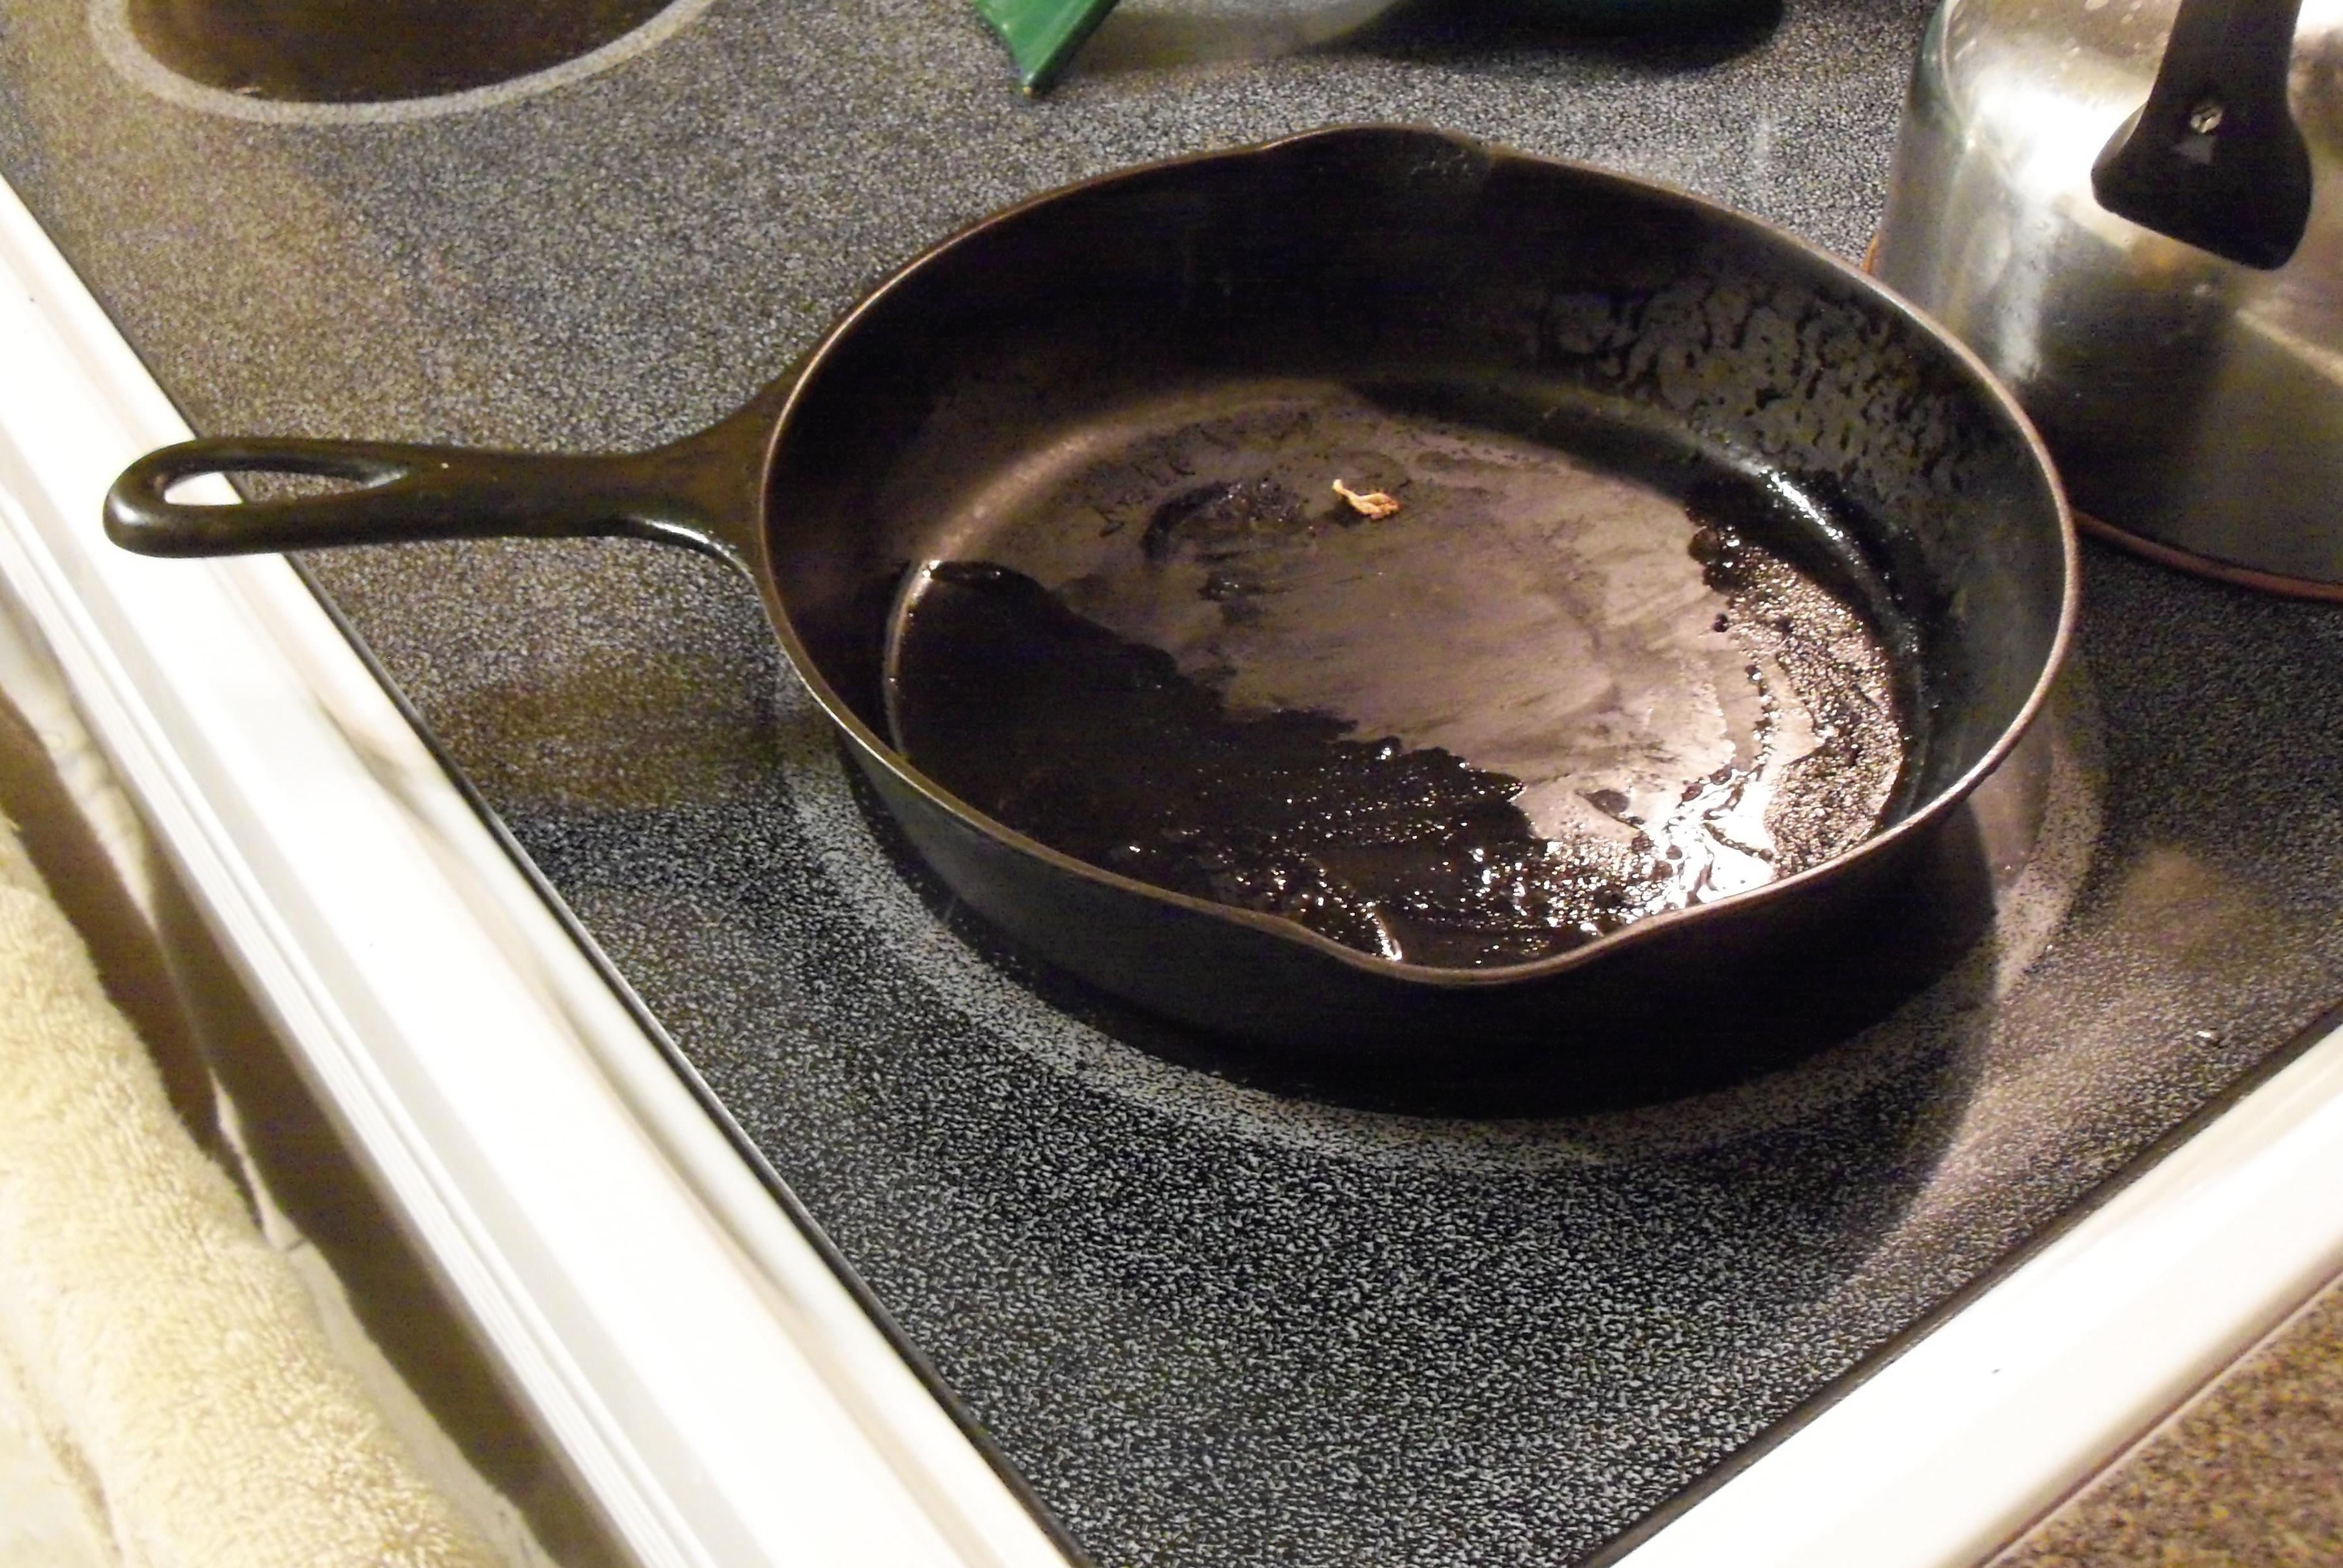 The Pancake test 🙂
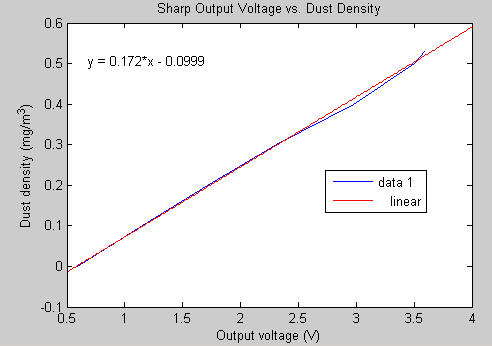
When you read the Sharp GP2Y1010AU0F Spec sheet Fig. 3 shows a Dust density (mg/m^3) versus voltage graph. But the graph starts at over 0.5 VDC. Unfortunately for most of my tests, the voltage was much lower. I entered the values off the graph and calculated a linear equation to approximate the mg/m^3 values.
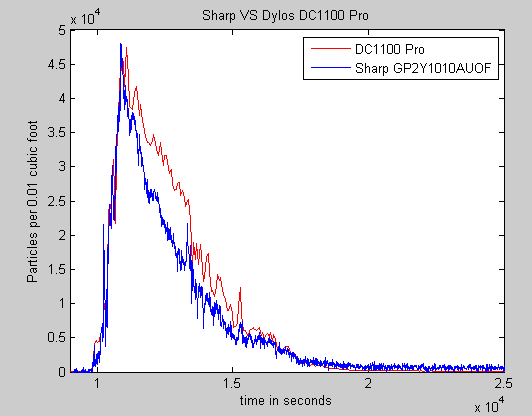
With the inexpensive Sharp sensor, I wanted to see how sensitive it was and I wanted to try to correlate the voltage to some meaningful metric. I tried a quick match test (blew out a match and let the smoke go over the sensor). The smoke quickly saturated the sensor. I wanted a longer term test. After seeing that the dylos sensor could see my daughter cooking lunch, I decided to do a “pan cake” test. Did you ever notice that after making pancakes in an old cast iron fry pan with butter, that the kitchen hazes up. I set up both the Dylos and Sharp sensors to capture the data to Pachube. This allowed me to compare/calibrate the sensors.
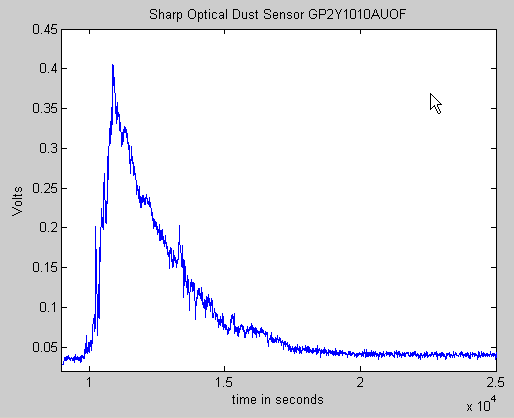
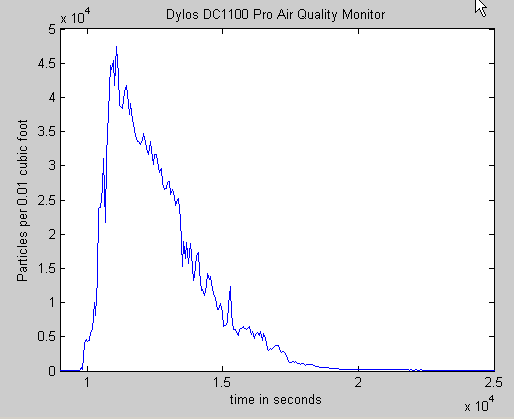
The two graphs are amazingly similar. Applying a simple offset and multiplication factor allowed the data to be overlaid.
(V-0.0356)*120000
The interesting thing is that Dylos has a chart to rate your air relative to other residential environments. The pancake test exceed these by 50X. So there is some question of how sensitive the Sharp unit is at very low particle counts.
Air Quality Chart - Small Count Reading (0.5 micron)+

3000 +     = VERY POOR
1050-3000  = POOR
300-1050   = FAIR
150-300    = GOOD
75-150     = VERY GOOD
0-75       = EXCELLENT
Materials
Results
Other types of real-time data have sites that users can share their data with the global Internet Community. For example, Weather Underground is a great place to store my weatherstation data. StrikeStar is wonderful for processing distributed lightning detectors data to produce real-time maps.
Pachube (“patch-bay”) connects people to devices, applications, and the Internet of Things. As a web-based service built to manage the world’s real-time data, Pachube gives people the power to share, collaborate, and make use of information generated from the world around them.
This is a perfect repository for our Dylos Air Quality and Sharp Air Quality data. It provides a simple HTTP interface to post data and applications which generate charts that can be included on your web pages:
References
Articles
- Lecture on Aerosol Light Scattering and Cloud Nucleation
- Development of a low-cost device for observing indoor particle levels associated with source activities in the home
- Air Egg Particle discussion
Sharp Sensor
Dylos
Grove Dust Sensor


